Building an Octopus Energy tracker for my Tidbyt
I was sad when I learned that Tidbyt got acquired by Modal, which likely means the inevitable death of my Tidbyt. That said, the news did remind me that I have a Tidbyt and that I always wanted to be able to track my electricity prices on it.
I subscribe to Octopus Energy, which awesomely has first-class support for a developer API.
I had never made a Tidbyt app before, and was quite surprised to learn that apps are built using Starlark, and that the architecture is such that the Tidbyt device does effectively no processing locally, instead it receives server-side rendered GIFs or WebP.
A hello world app is as simple as:
load("render.star", "render")
def main():
    return render.Root(
        child = render.Text("Hello, Tidbyt!")
    )
What I wanted from the app
What I wanted to be able to get out of my app is the following:
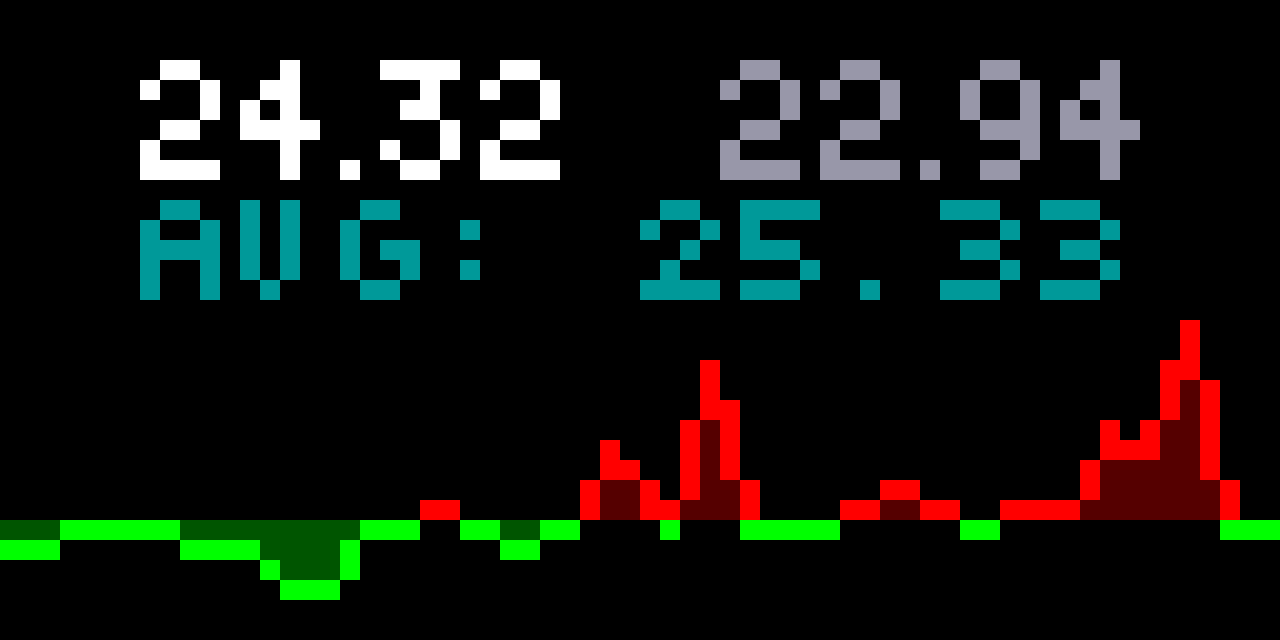
- today’s price (in pence per kilowatt hour)
- tomorrow’s price
- the average price over the last N days
- bonus points if I could make a pretty graph of the last N days
Getting the prices
Figuring out my prices for electricity was more complicated than I expected, as I had to figure out which product code I am subscribed to.
I was able to figure it out by provisioning an API key and using their list products
I was able to get my account number from a previous bill, or through their mobile app.
curl -u "$OCTOPUS_API_KEY" "https://api.octopus.energy/v1/accounts/$ACCOUNT_NUMBER/" | jq
The curl will ask you for a host password, but you can just send an empty one.
Using the results, I was able to figure out my cryptic tariff code:
E-FLAT2R-SILVER-BB-23-12-06-C.
Using this, I was able to craft a curl request to get the prices for a given time range:
curl "https://api.octopus.energy/v1/products/SILVER-BB-23-12-06/electricity-tariffs/E-FLAT2R-SILVER-BB-23-12-06-C/day-unit-rates/?period_from=2025-01-19T00:00Z&period_to=2025-01-19T01:29Z" | jq
For example for that one day I get the following:
{
  "count": 1,
  "next": null,
  "previous": null,
  "results": [
    {
      "value_exc_vat": 24.36,
      "value_inc_vat": 25.578,
      "valid_from": "2025-01-19T00:00:00Z",
      "valid_to": "2025-01-20T00:00:00Z",
      "payment_method": null
    }
  ]
}
One thing I learned is that you can query the prices of the next day, but only after some time around noon in the current day.
Getting them in Starlark
Once I figured this part out, I just had to use the Tidbyt http library to fetch the price of today and tomorrow.
load("http.star", "http")
load("time.star", "time")

timezone = "Europe/London"
now = time.now().in_location(timezone)
tomorrow = now + (time.hour * 24 * 2)
start = now


product = "SILVER-BB-23-12-06"
tariff = "E-FLAT2R-SILVER-BB-23-12-06-C"
period_from = start.format("2006-01-02T00:00Z")
period_to = tomorrow.format("2006-01-02T00:00Z")

price_url = "https://api.octopus.energy/v1/products/{}/electricity-tariffs/{}/day-unit-rates/?period_from={}&period_to={}".format(product, tariff, period_from, period_to)
print("price_url", price_url)

rep = http.get(price_url)
if rep.status_code != 200:
	fail("Octopus request failed with status %d", rep.status_code)
Putting it all together (draw the rest of the owl)
In reality, I wanted to be able to get the last 30 days, compute the average, and display a graph.
Luckily, Tidbyt provides libraries for math operations and graphing libraries so it was quite easy to build.
Their graphing library allows you to configure the color for negative and positive values (e.g., red for negative and green for positive), so in order to take advantage of that I shifted the graph data points such that the average of the last 30 days becomes 0; any value below would be colored green, and any value above would be red (since more expensive is bad).
You can find the full source code over at Github.
You can see a rendered example here:

Wait how do I get this to run on my Tidbyt?
There is a way to push a locally rendered view onto my Tidbyt using
pixlet render octopus_energy.star && pixlet push TIDBYT_ID octopus_energy.webp -installation-id octopusenergy
This will show your app, and add it to the rotation (since we gave it an
installation-id). However, it will not dynamically reload, i.e., it will
forever show the price of electricity at the time of locally rendering.
If you want the app to be dynamically reloadable Tidbyt suggests that you add it to the community repo.
However, at the time of writing the last commit was 2 months old, and given the news that they were acquired it doesn’t look like that will get any better.
So I guess we’ll be stuck re-rendering and pushing it to be able to get a dynamic app.
Synology NAS to the rescue
I have a Synology DS920+ at home which is more than perfectly capable of running this through a simple container in Container Manager.
We just need an image with the pixlet command, the source code, and we’ll be
off to the app races.
After a quick search, it looks like I didn’t even need to make an image myself
thanks to coominpickle’s pixlet-push-update.
The version of docker that Synology ships with is old so I had to make a slight
modification, since it doesn’t support restart: unless-stopped (I used
restart: always instead).
I configured it to run every hour and to run off my volume2 which is an M.2
NVMe. I also had to get my pixlet API key via the Tidbyt mobile app.
version: '3.8'
services:
  pixlet-push:
    image: coominpickle/pixlet-push-update:latest
    environment:
      - PIXLET_API_TOKEN=<YOUR API TOKEN>
      - PIXLET_INSTALLATION_ID=octopusenergy
      - PIXLET_DEVICE_ID=<YOUR DEVICE ID>
      - UPDATE_INTERVAL=3600
    volumes:
      - /volume2/docker/pixlet-push/octopus_energy.star:/app.star
    restart: always
Putting it all together
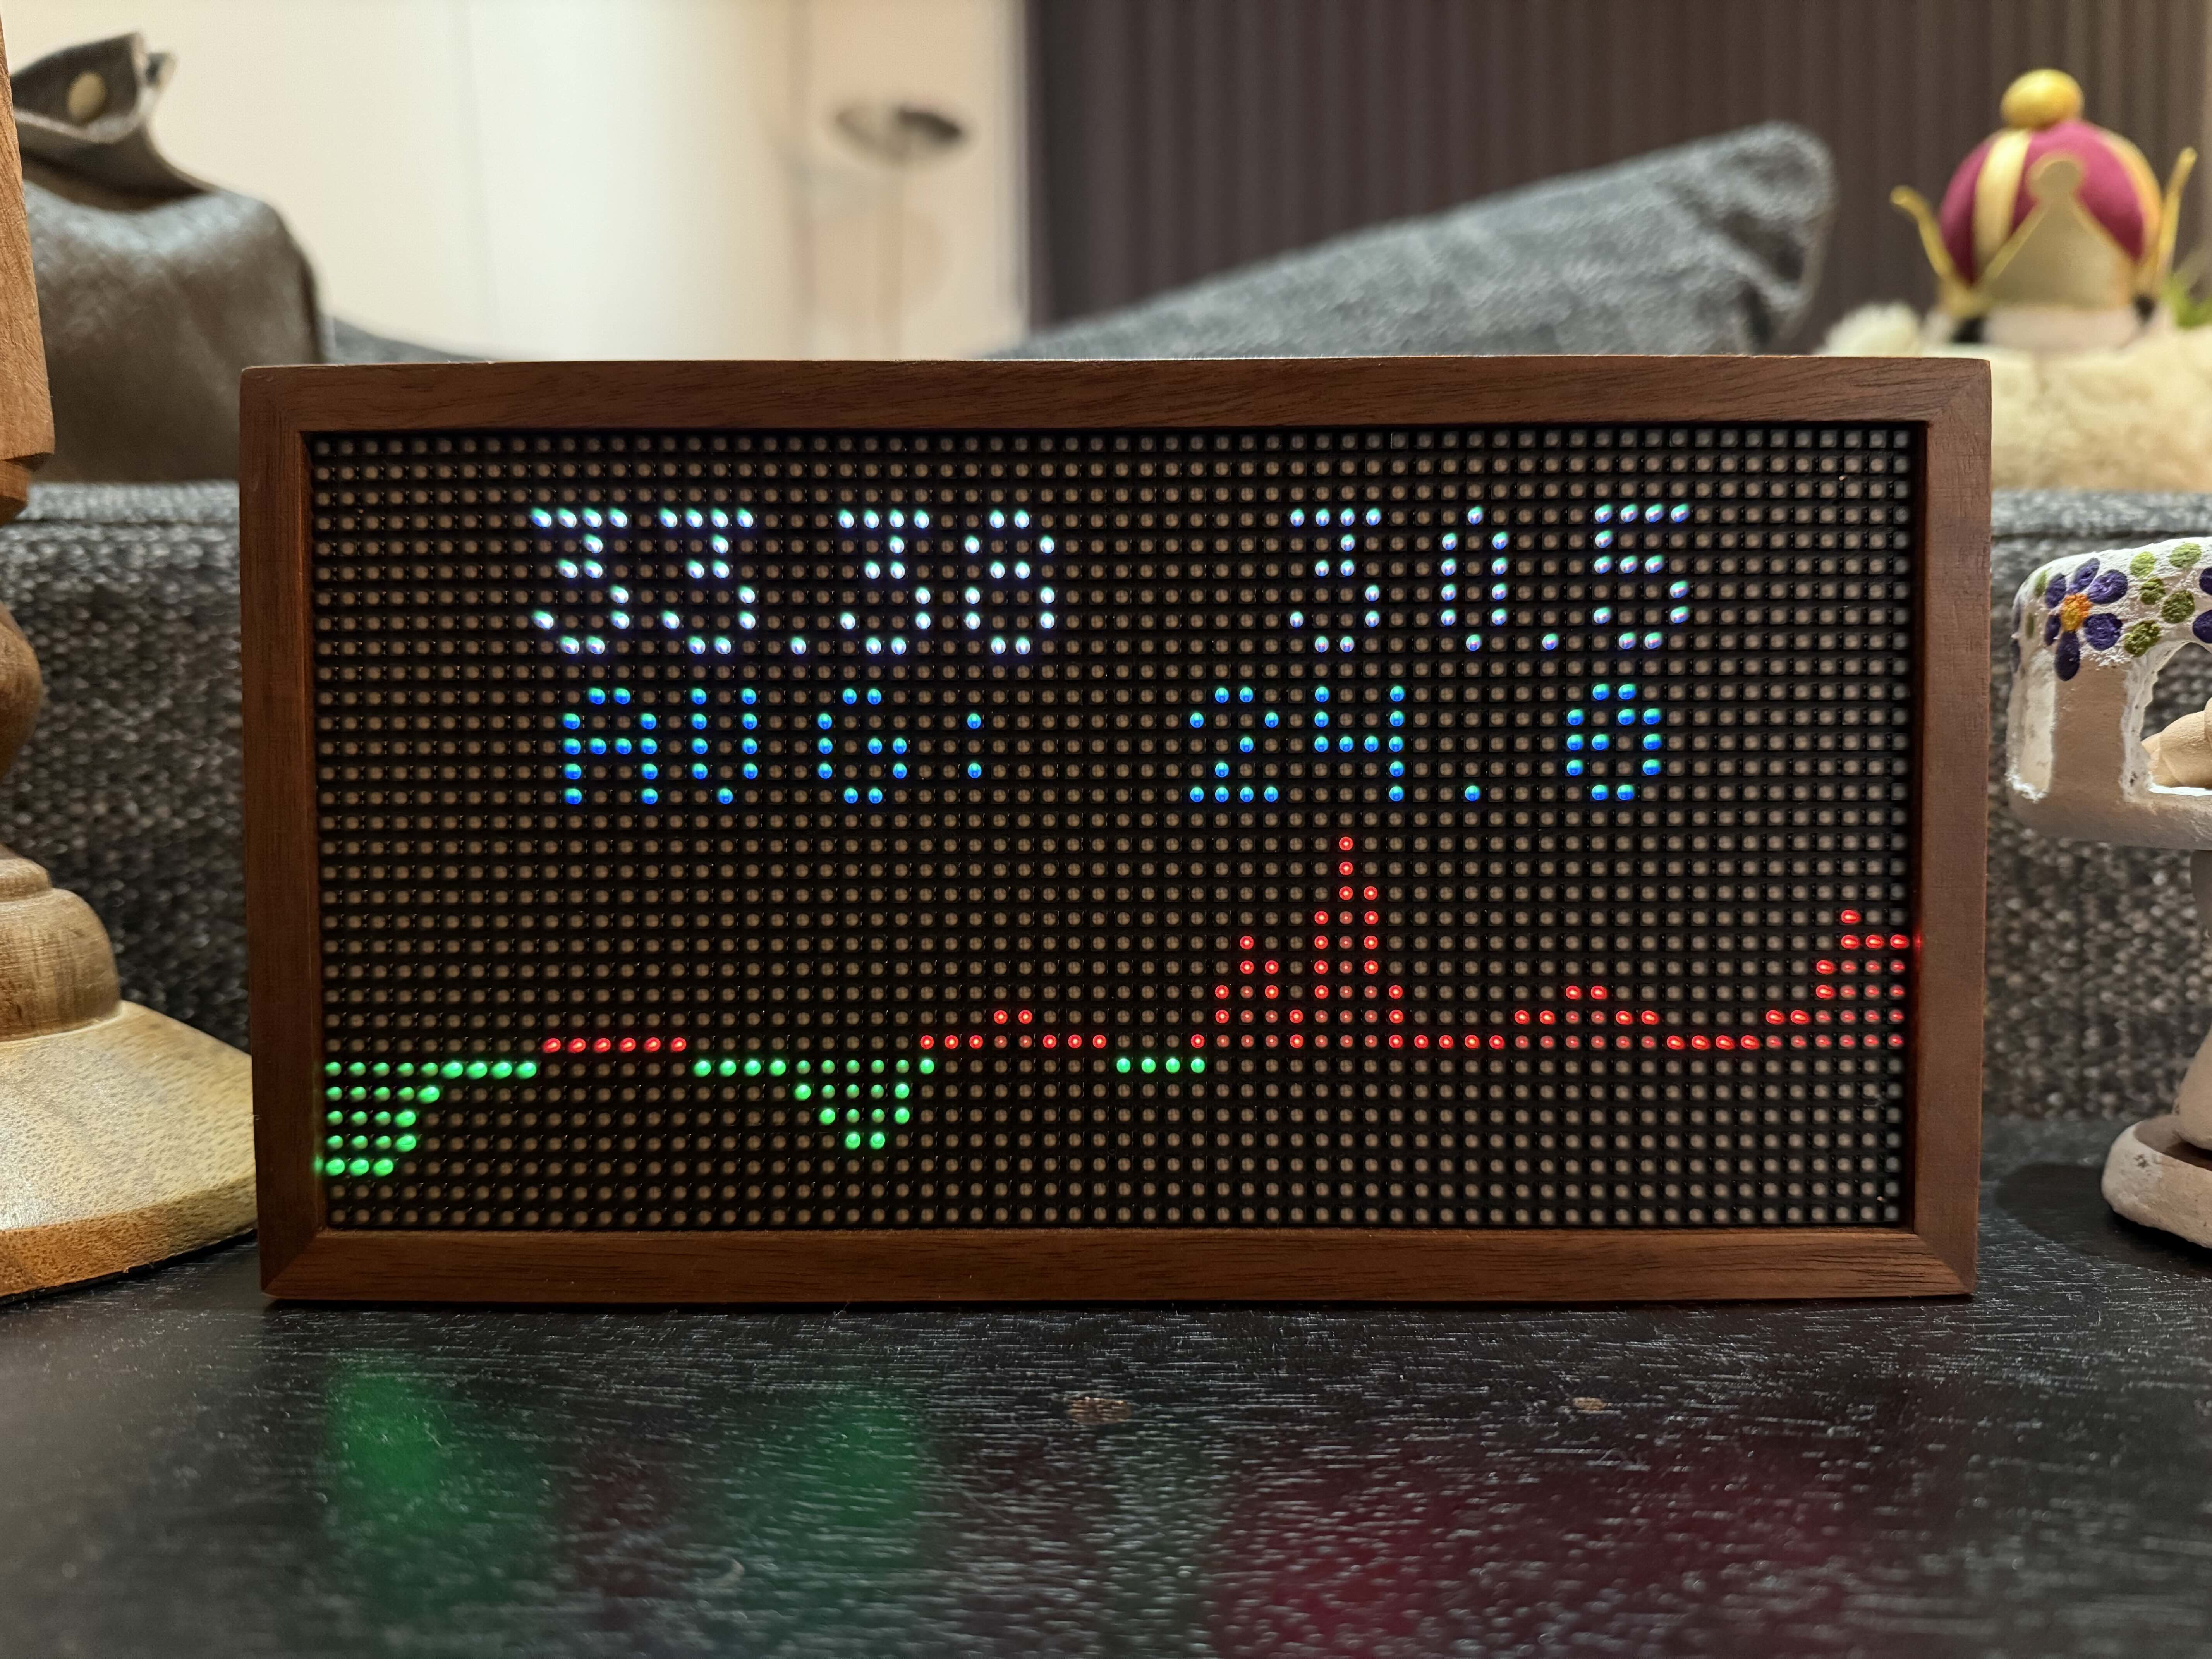
And voila, I had my own dynamic Tidbyt app!

There is still lots of improvements to make on the app side, most notably:
- the app naively takes the latest two data points to be today and tomorrow, but this is not true before tomorrow’s price is published (i.e., before ~noon). So I need to change it to actually check the date on the returned price and only display today if there is no tomorrow yet.
- it would be better if I could somehow label today and tomorrow’s prices
- I would like to add percentage changes (either between today and tomorrow) and/or compared to the average price
Furthermore, although I am rendering the application locally, deploying it still depends on Tidbyt keeping their lights on. I may want to look at how to use my Tidbyt without depending on their servers at all (and hopefully also be able to use a real programming language to make apps).